
Course
Introduction to Power BI
4 hr
361.1K
Get your team access to the full DataCamp library, with centralized reporting, assignments, projects and more
A Power BI Dashboard doesn’t only need to be aesthetic but also clear and useful. There are many dimensions by which you can evaluate a Power BI dashboard. In our article on the best practices for designing dashboards, we outline the best practices for building dashboards in Power BI (and any tool, as a matter of fact). Here are the key characteristics of a great Power BI dashboard:
Different dashboards have different audiences and different uses. Operational dashboards monitor real-time data of business operations and are used by operational teams (e.g., marketing teams), whereas strategic dashboards monitor long-term company OKRs and KPIs and are used by C-level executives. Great dashboards always consider the needs of the audience first.
It’s easy to throw everything but the kitchen sink at a dashboard. Anyone creating dashboards needs to think deeply about the tradeoff between complexity and usefulness. As such, always ensure that dashboards provide the most useful information possible, without adding unnecessary clutter.
Using a grid layout not only helps you be more productive when creating dashboards but enables audiences to follow a seamless journey. According to Andy Cotgreave, Technical Evangelist at Tableau and co-author of the Big Book of Dashboards, humans are naturally geared to look at things from left to right and top to bottom. Using a grid layout helps your audience navigate dashboards.
Dashboards should be, above all, useful. However, the aesthetics of a dashboard (or lack thereof) can seriously impact its adoption. As a general rule of thumb, always ensure you’re not using more than one font for your dashboard and that you’re using colors creatively to guide the audience in their consumption journey.
Load time matters in the adoption of almost any digital product, and dashboards are no different. Even if a dashboard ticks all the boxes, it will barely be used if it has long wait times. A great way to minimize load times is to remove clutter, ensure data transformations are stored in views in databases, and balance between complex and simple visualizations.
Now that we have best practices lined up, here are top Power BI dashboard examples from verticals such as Sales, Finance, Healthcare, and more.
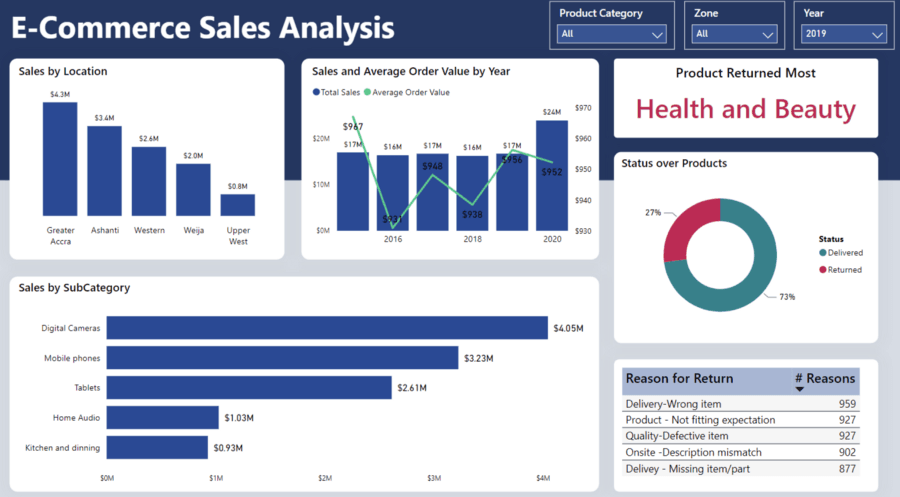
This interactive dashboard is designed to be used by online retailers and provide them with a high-level to a granular understanding of how different products are performing. It provides an overview of total sales, with the ability to showcase yearly, quarterly, and monthly growth rates. Moreover, it allows anyone to dig through the data and understand the top-performing products, locations, and more.
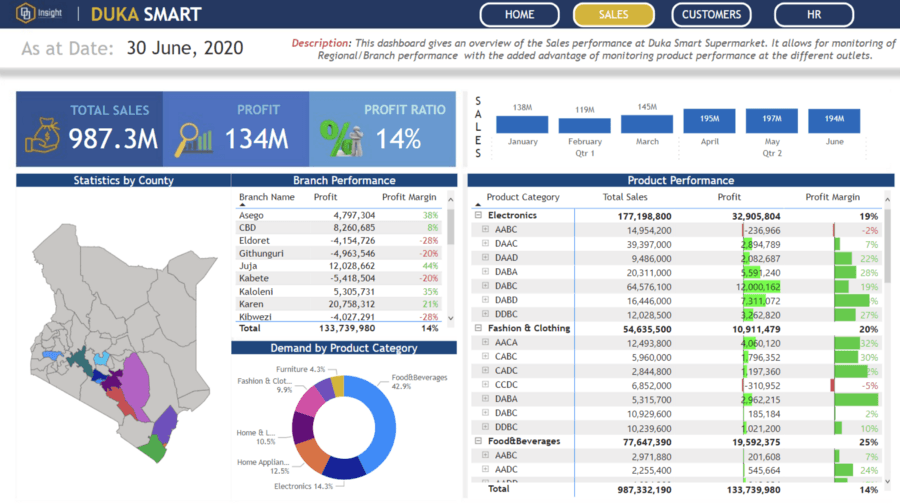
This is an incredibly concise yet holistic dashboard that allows an at-a-glance view of the financial performance of a Supermarket chain in Kenya. It provides three reports, covering overall sales data with the ability to break it down by product category, customer demographics data, alongside staff costs and headcount data across different supermarket branches.
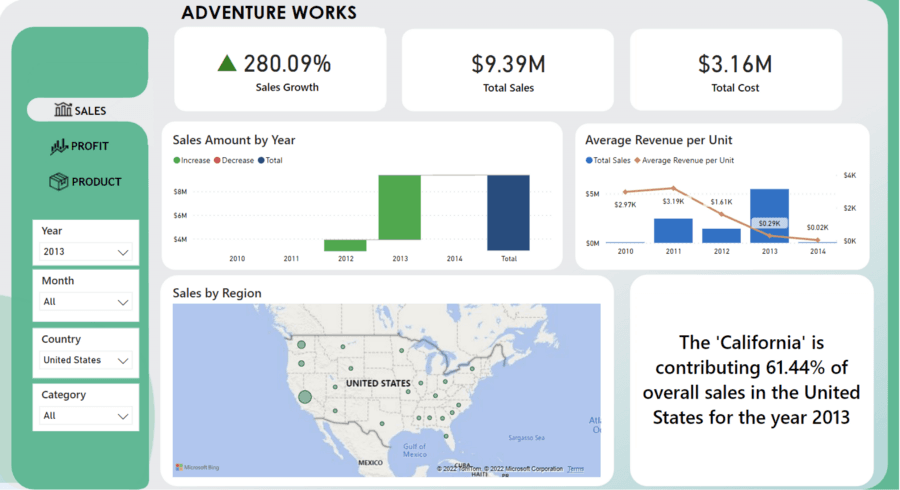
This dashboard tracks the sales performance of a fictional bicycle manufacturer named AdventureWorks. It provides a great overview of total sales and growth over time with the ability to drill down by product category. Moreover, it provides excellent comparison features between different years and months, alongside a great map of sales by region.
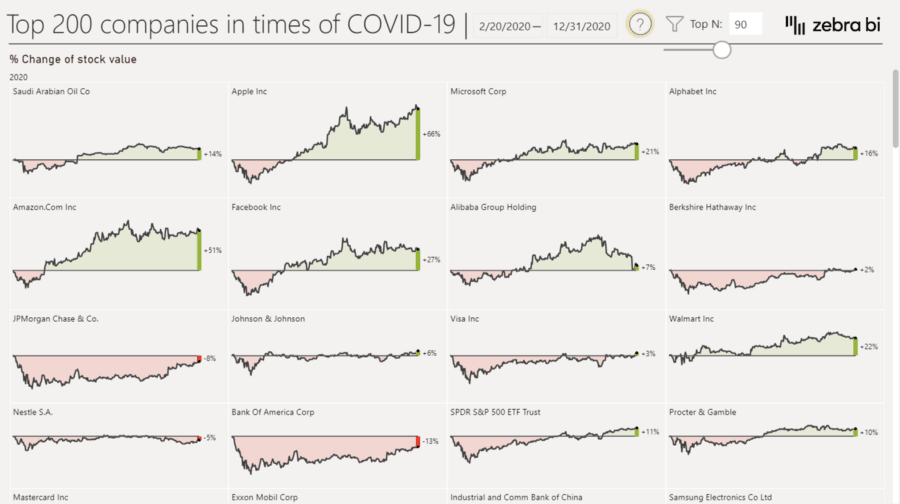
At the onset of the pandemic, many organizations suffered tremendous stock market losses before achieving recovery. This dashboard provides a great overview of the top 200 companies (in terms of stock price performance) during the first year of Covid-19. Combining simple visuals and great filtering abilities, it showcases the usefulness of Power BI dashboards in Finance.
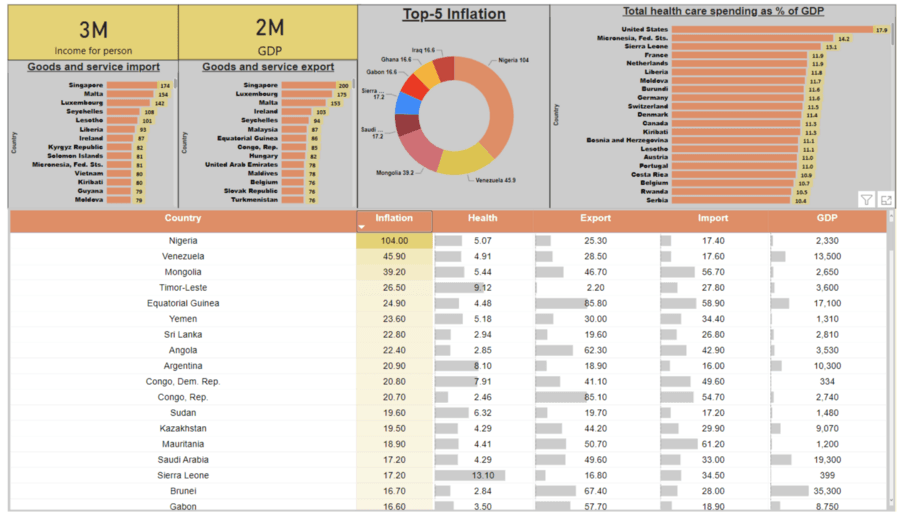
“Inflation is a measure of the rate of rising prices of goods and services in an economy. If inflation is occurring, leading to higher prices for basic necessities such as food, it can have a negative impact on society.” — Investopedia
Inflation has never been more real with the ramifications of Covid-19 and the Russia-Ukraine war. This dashboard provides an overview of inflation across different countries, alongside other economic indicators such as import and export data, size of GDP, and more.
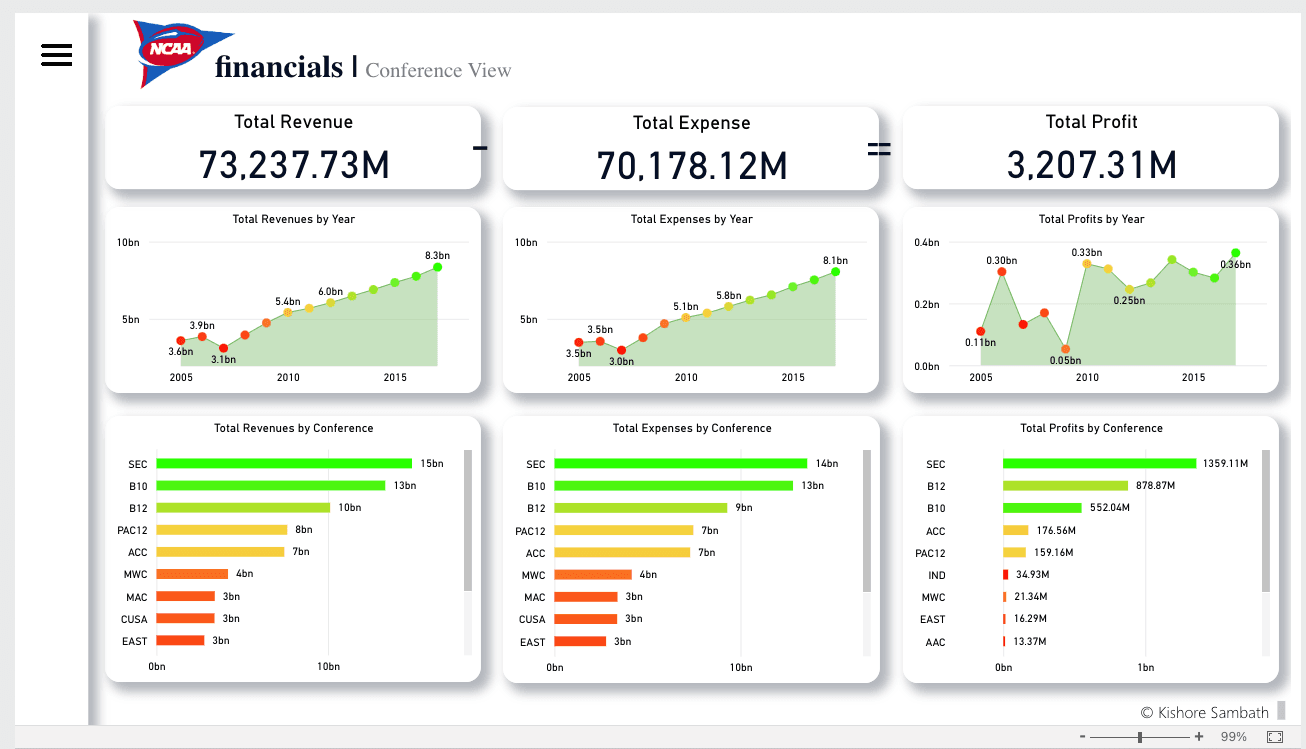
NCAA stands for National Collegiate Athletic Association and is an organization that manages student athletics in the United States and Canada. This dashboard highlights the financial performance of the NCAA — with high-level overviews of total revenue, expenses, and profits. Moreover, it provides the audience the ability to filter this data by conference, and by participating school.
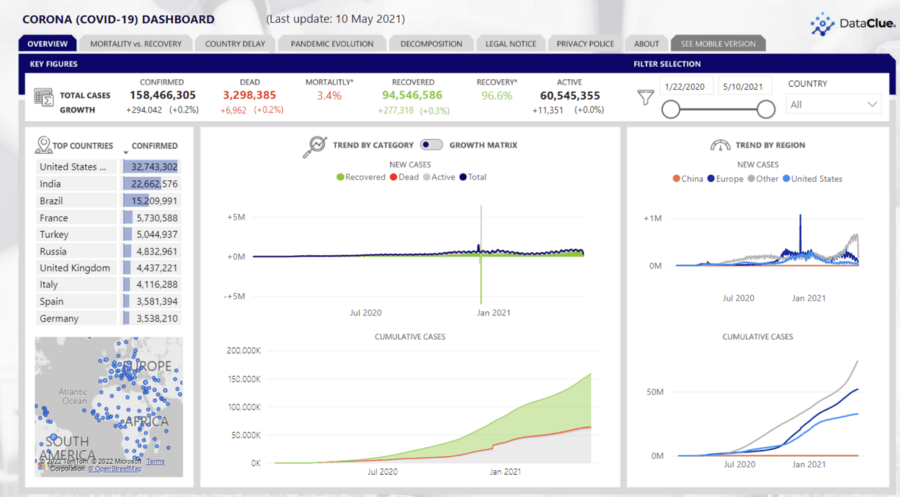
Arguably the biggest data story of the past decade, Covid-19 spread and impact is a prime dashboard example. This dashboard helps audiences understand how Covid-19 is spreading across countries, recovery and mortality rates, detailed country comparisons, and more.
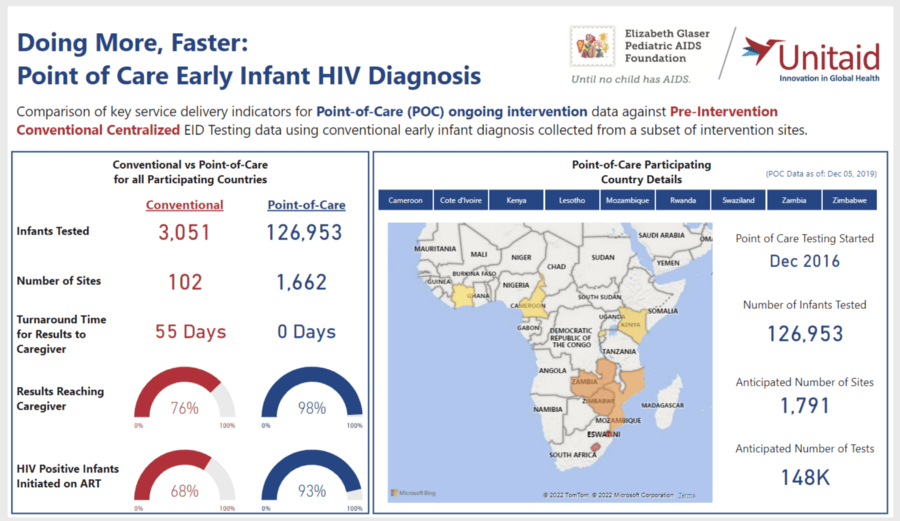
The Point-of-Care Early Infant Diagnosis (POC EID) data dashboard seeks to evaluate the impact of point-of-care early HIV diagnosis in infants. This project involved nine African states: Cameroon, Côte d’Ivoire, Kenya, Lesotho, Mozambique, Rwanda, Eswatini, Zambia, and Zimbabwe. The dashboard provides the audience a great overview of how point-of-care testing compares to conventional methods and can be used by doctors and public policy officials alike.
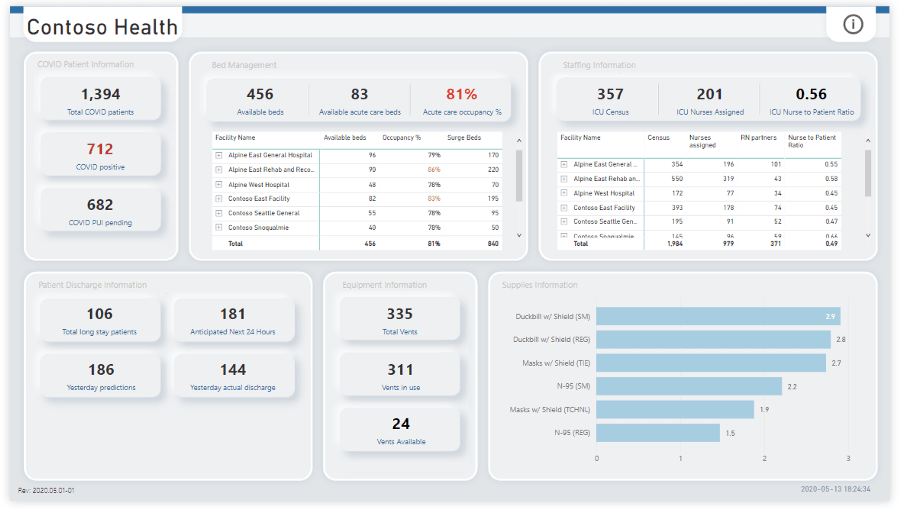
The dashboard provides hospital administrators an excellent overview of current operations and bottlenecks in their hospital. It provides an overview of bed occupancy, discharges, and the availability of staff, alongside the supply of important safety materials and products. Alongside this overview, it provides the ability to drill through all of these particular metrics at greater detail.
This article showed you an overview of how Power BI enables anyone to build incredibly rich dashboards that provide value to any consumer. Power BI is one of the most important tools in driving data-driven decision-making within organizations, and one of the most sought-after tools to learn by practitioners.
If you are interested in becoming a Power BI expert, check out the Data Analyst in Power BI Career Track, which covers all you need to know to make dashboards confidently in Power BI. For more learning on Power BI, check out the resources below:
Power BI courses
Course
Course
Course
tutorial
Kafaru Simileoluwa
18 min
tutorial
Maarten Van den Broeck
8 min
tutorial
DataCamp Team
16 min
tutorial
Parul Pandey
16 min
code-along
Iason Prassides
code-along
Nick Switzer